
My first INFOGRAPHIC!
- suvdanchimegotgonb
- Apr 4, 2025
- 2 min read
Updated: Apr 13, 2025
Until last week, I was only familiar with basic programs like PowerPoint, Word, and Excel.
Then.., I was introduced to infographics. I even created my first one! Join me as I take you through my journey of discovering and designing an infographic.
First let me tell what an infographic is, in case you are wondering. Infographic is a visual representation that combines text, images and graphics to present information quickly and effectively.
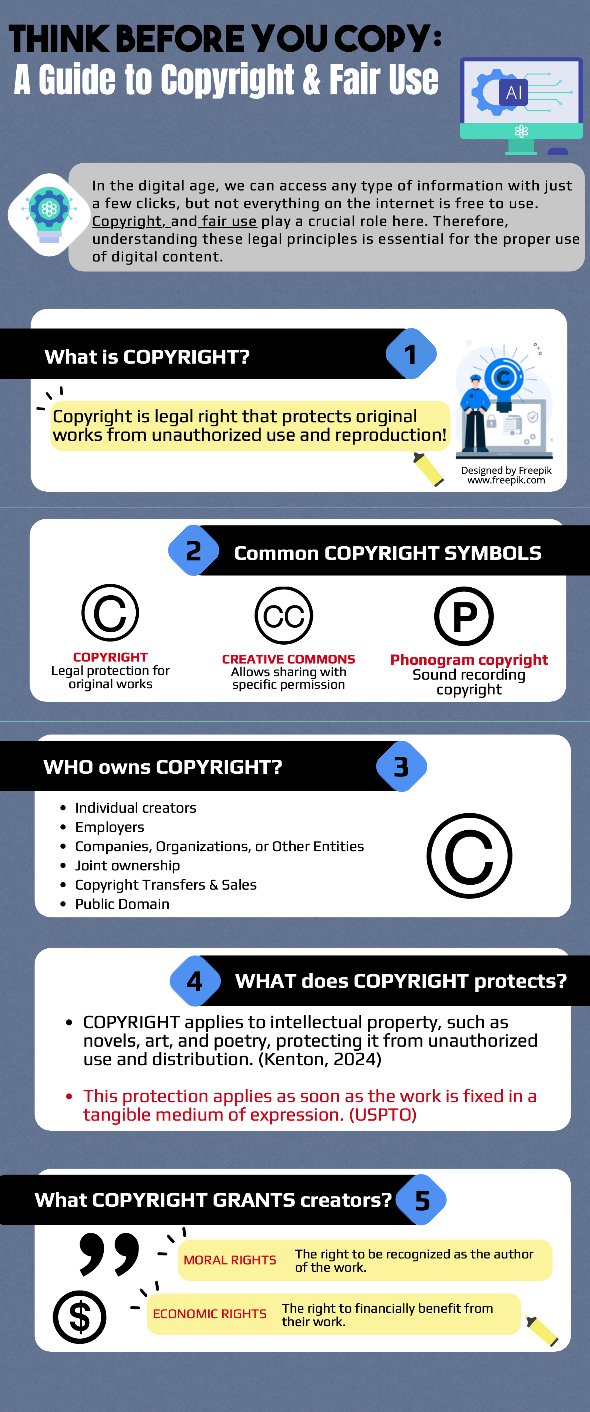
I was supposed to select a legal and ethical issue in digital media and create an infographic about it for my ICT class. I chose copyright and fair use because I wanted to explore this topic further and share my findings with others. To create my infographic I used https://piktochart.com, a tool, that offers various template designs which are easy to use and edit for your purpose. However, I encountered some limitations, such as performance issues and limited graphic usage in the free version. For example, some of my work was not saved and the website stopped working several times. In addition to these technical issues, I also faced challenges with content. Since copyright and fair use are legal terms, I was unsure whether I could paraphrase information in my own words or if I had to strictly cite qualified sources.
Now, let’s look at some potential benefits of infographics. Infographics are useful for both the creator and the viewer. For the creator, designing an infographic requires recalling and organizing key information, since the goal is to simplify a complex topic. For the viewer, infographics offer quick and efficient access to well-structured, easy-to-understand content.
Here’s the infographic I created on the topic of copyright and fair use:


Comments